> ## Documentation Index
> Fetch the complete documentation index at: https://docs.dune.com/llms.txt
> Use this file to discover all available pages before exploring further.
# Data Hub Overview
> The Dune Data Hub is your central workspace for querying, visualizing, and sharing blockchain data insights.
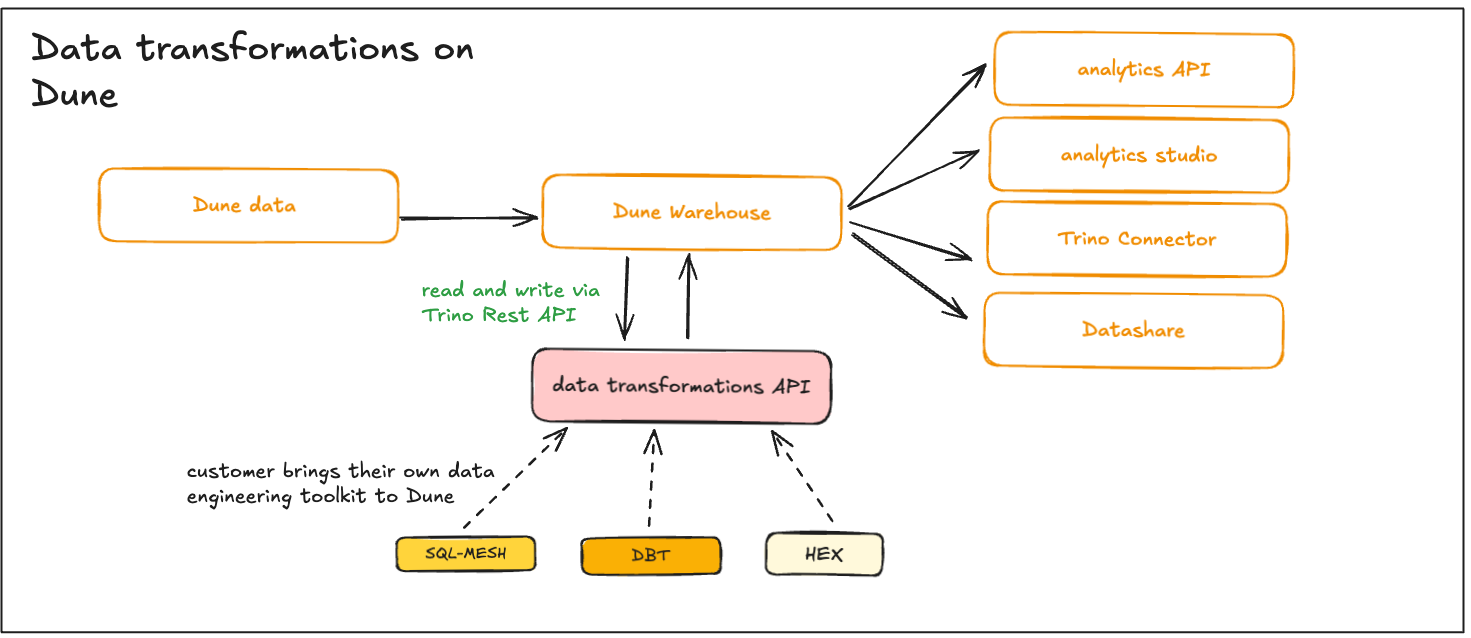
The Data Hub is Dune's web-based workspace where you query blockchain data with SQL, build visualizations, assemble dashboards, and share insights with your team or the public. It is one of several ways to work with Dune's data -- alongside the [Data API](/api-reference/api-overview), [dbt integration](/api-reference/connectors/dbt/overview), [BI tool connectors](/api-reference/connectors/trino/overview), and [Datashare](/datashare/datashare).
 ## Prerequisites
* **Dune Account:** [Sign up here](https://dune.com/auth/register) if you do not already have one.
* **Basic SQL Knowledge:** Dune uses DuneSQL, a SQL dialect compatible with TrinoSQL. If you are new to SQL, [start here](https://www.w3schools.com/sql/).
## What You Can Do
Use the Query Editor to write SQL against blockchain data, add parameters, and schedule automated runs.
Turn query results into charts, counters, tables, and interactive dashboards.
Schedule queries and dashboards to refresh automatically. Set up alerts for email or webhook notifications.
Share dashboards by URL, embed live visualizations on any website, or export data via CSV and API.
Upload your own CSV datasets to join with blockchain data. Export query results in CSV or JSON.
Submit contracts for decoding to create structured, queryable tables from raw transaction bytecode.
Create team workspaces, assign roles, share credits, and configure SSO for your team.
Enterprise: multiple teams under one subscription, shared usage, and centralized security and billing.
Find dashboards, queries, and analysts across Dune using search, discovery, and advanced filters.
## Quick Start
Get from zero to a published dashboard in five minutes:
1. **Create a query** -- Open the [Query Editor](https://dune.com/queries) and write SQL. For example, daily Ethereum active addresses:
```sql theme={null}
SELECT
date_trunc('day', block_time) AS time,
COUNT(DISTINCT "from") AS active_senders
FROM ethereum.transactions
WHERE block_time > DATE '2024-01-01'
GROUP BY 1
ORDER BY 1
```
2. **Run and save** -- Click **Run** to execute, then **Save** to persist your query.
3. **Add a visualization** -- Click **New Visualization**, choose a chart type, and configure your axes.
4. **Build a dashboard** -- Go to **Create > New Dashboard**, name it, then add your visualization as a widget.
5. **Share it** -- Copy the dashboard URL or use the **Share** button to embed it externally.
For a detailed walkthrough, see [Create Your First Query](/learning/how-tos/create-your-first-query) and [Create Your First Visualization](/learning/how-tos/create-your-first-visualization).
## Next Steps
* **[Query Templates](/learning/how-tos/query-templates):** Pre-built queries you can customize immediately.
* **[Data Catalog](/data-catalog/overview):** Explore all available blockchain data tables.
* **[Video Tutorials](/resources/learning/video-tutorials):** Visual walkthroughs of every Data Hub feature.
## Prerequisites
* **Dune Account:** [Sign up here](https://dune.com/auth/register) if you do not already have one.
* **Basic SQL Knowledge:** Dune uses DuneSQL, a SQL dialect compatible with TrinoSQL. If you are new to SQL, [start here](https://www.w3schools.com/sql/).
## What You Can Do
Use the Query Editor to write SQL against blockchain data, add parameters, and schedule automated runs.
Turn query results into charts, counters, tables, and interactive dashboards.
Schedule queries and dashboards to refresh automatically. Set up alerts for email or webhook notifications.
Share dashboards by URL, embed live visualizations on any website, or export data via CSV and API.
Upload your own CSV datasets to join with blockchain data. Export query results in CSV or JSON.
Submit contracts for decoding to create structured, queryable tables from raw transaction bytecode.
Create team workspaces, assign roles, share credits, and configure SSO for your team.
Enterprise: multiple teams under one subscription, shared usage, and centralized security and billing.
Find dashboards, queries, and analysts across Dune using search, discovery, and advanced filters.
## Quick Start
Get from zero to a published dashboard in five minutes:
1. **Create a query** -- Open the [Query Editor](https://dune.com/queries) and write SQL. For example, daily Ethereum active addresses:
```sql theme={null}
SELECT
date_trunc('day', block_time) AS time,
COUNT(DISTINCT "from") AS active_senders
FROM ethereum.transactions
WHERE block_time > DATE '2024-01-01'
GROUP BY 1
ORDER BY 1
```
2. **Run and save** -- Click **Run** to execute, then **Save** to persist your query.
3. **Add a visualization** -- Click **New Visualization**, choose a chart type, and configure your axes.
4. **Build a dashboard** -- Go to **Create > New Dashboard**, name it, then add your visualization as a widget.
5. **Share it** -- Copy the dashboard URL or use the **Share** button to embed it externally.
For a detailed walkthrough, see [Create Your First Query](/learning/how-tos/create-your-first-query) and [Create Your First Visualization](/learning/how-tos/create-your-first-visualization).
## Next Steps
* **[Query Templates](/learning/how-tos/query-templates):** Pre-built queries you can customize immediately.
* **[Data Catalog](/data-catalog/overview):** Explore all available blockchain data tables.
* **[Video Tutorials](/resources/learning/video-tutorials):** Visual walkthroughs of every Data Hub feature.